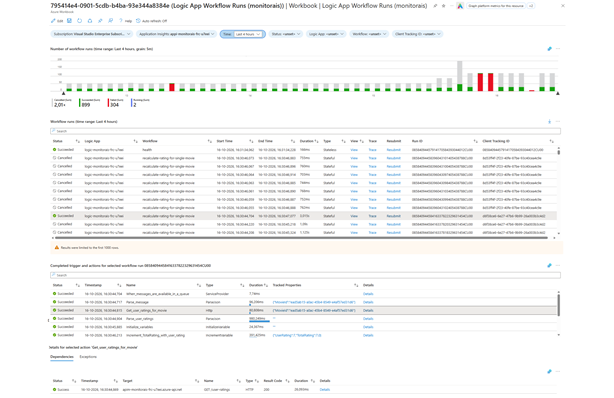
The Insights screen of a Logic App shows workflow runs, but only for a single Logic App and with some limitations. In this post, I walk through an Azure Workbook that shows the runs of multiple Logic Apps in one place, including cancelled runs, a graph over time, trace links and the option to view or resubmit a run.
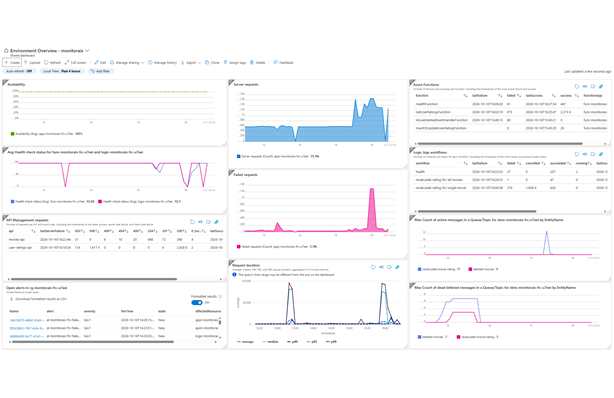
Integrations built with Azure Integration Services can include components from several services, each with its own monitoring experience. In this post, I show how I bring API Management requests, Azure Functions, Logic App workflows and Service Bus signals together in an Azure dashboard, then turn that dashboard into a reusable Bicep deployment.
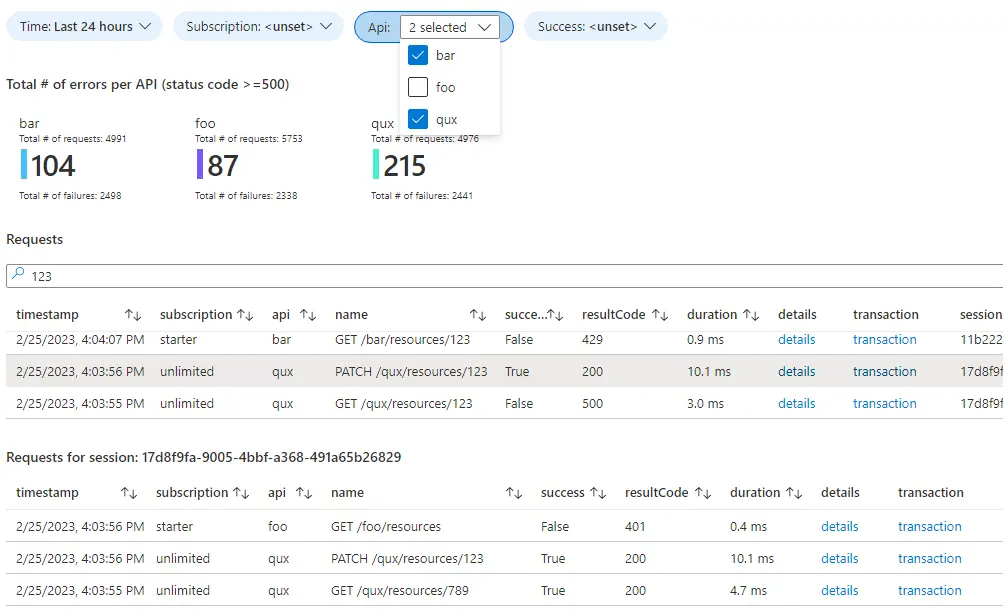
If you use Azure, you most likely use Application Insights for logging. You can use a dashboard to visualize your logging and gain better insights, but dashboards come with some limitations. For more flexibility Azure has workbooks. In this blog post I’ll share some tips & tricks that I’ve gathered over the years. As a sample, we’ll create a workbook that shows information about requests sent to an API Management instance.