
Track Availability in Application Insights using Standard Test
I’ve been working on multiple integration projects in the last couple of years using Azure Integration Services. When connecting to an external system, one of the first things I do is create an availability test. This helps me monitor if the system is up, verify that all security measures are in place and up to date (like client secrets or certificates), and verify that the system can be reached.
Most of the time there are VNets, Network Security Groups, Azure Firewalls and IP whitelists between the integration resources and the backend system. I’ve had multiple occasions where somebody cleaned up the infrastructure and removed too much. The availability test quickly identified this issue, making it easier to troubleshoot.
In this post, I’ll show you how to track availability in Application Insights using a standard test. While Microsoft’s documentation on Application Insights availability tests gives a good overview of creating a standard test via the portal, I’ll focus on creating one through Bicep.
This is the first post in a series about tracking availability in Application Insights:
- Track Availability in Application Insights using Standard Test - this post
- Track Availability in Application Insights using .NET (Azure Function)
- Track Availability in Application Insights using Logic App workflow
Table of Contents
- Solution Overview
- Creating a Standard Test with Bicep
- SSL Certificate Validation
- Viewing Availability Test Results
- Setting Up Alerts
- Considerations
- Conclusion
Solution Overview
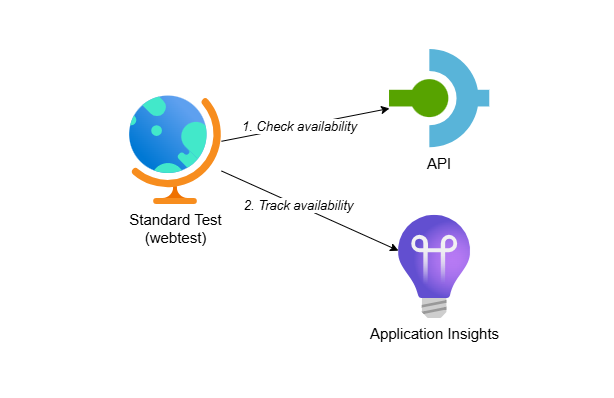
The solution includes the following components:
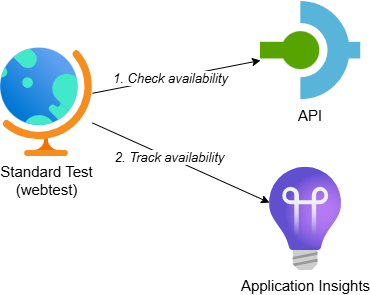
- Standard Test (webtest): A standard test that checks the availability of the API
- API: Represents a backend system for which we want to track availability. It randomly returns a 200 OK or 503 Service Unavailable response based on a configurable ‘approximate failure percentage’
- Application Insights: Contains the standard test and shows the availability test results
While this example uses an API on API Management, the same approach applies when calling any other backend system for which you want to track availability.
To make deployment easier, I’ve created an Azure Developer CLI (azd) template: Track Availability in Application Insights. The template demonstrates three scenarios for tracking availability: standard test (webtest), .NET Azure Function and Logic Apps workflow. If you want to deploy and try the solution, check out the getting started section for the prerequisites and deployment instructions. This post focuses on the standard test.
Creating a Standard Test with Bicep
We can use the Microsoft.Insights/webtests resource to create a standard test in Application Insights. Here’s an example:
resource availabilityTest 'Microsoft.Insights/webtests@2022-06-15' = {
  name: availabilityTestName
  location: location
  tags: {
    'hidden-link:${appInsights.id}': 'Resource'
  }

  properties: {
    Name: 'Standard Test - Backend API Status'
    Description: 'Status of the backend API tested from a standard test (webtest)'
    SyntheticMonitorId: 'Standard Test - API Management SSL Certificate Check'

    Kind: 'standard'
    Enabled: true
    RetryEnabled: false

    Frequency: 300

    Locations: [
      {
        Id: 'emea-nl-ams-azr' // West Europe
      }
      {
        Id: 'emea-gb-db3-azr' // North Europe
      }
      {
        Id: 'emea-ru-msa-edge' // UK South
      }
      {
        Id: 'emea-fr-pra-edge' // France Central
      }
      {
        Id: 'emea-ch-zrh-edge' // France South
      }
    ]

    Request: {
      HttpVerb: 'GET'
      RequestUrl: 'https://<your-api-management-service-name>.azure-api.net/backend/status'
    }

    ValidationRules: {
      ExpectedHttpStatusCode: 200
      IgnoreHttpStatusCode: false
      SSLCheck: false
    }
  }
}
Let’s break down the key configuration options:
The Name property is what you’ll see in the availability test overview in the Azure portal. The SyntheticMonitorId is the unique ID of this test and is typically the same value as the Name property.
The hidden-link tag in the tags section links the web test to the Application Insights resource, which allows Application Insights to display the test results.
The Frequency property controls how often the test runs. A frequency of 300 means the test executes every 5 minutes from all configured locations. This is an important distinction: if you have 5 locations configured, the test will run 5 times every 5 minutes, not once every 5 minutes total. The tests from different locations don’t run at exactly the same time but are distributed across the 5-minute window. They also aren’t distributed evenly, so there might not be a test execution every minute.
The Locations array specifies in which Azure regions the test will run. You can find the complete list of available locations in the Microsoft documentation. I typically configure multiple locations to get better coverage and to distinguish between regional issues and actual backend failures. If you expect clients from specific regions, make sure to include those regions in your test locations.
The Request section defines what HTTP request to make. In this example, I’m calling a status endpoint on API Management, but you can call any publicly accessible endpoint.
The ValidationRules section specifies what constitutes a successful test. In this case, I’m expecting a 200 status code. The IgnoreHttpStatusCode property is set to false, meaning the test will fail if it receives any status code other than 200.
I’ve set RetryEnabled to false for this demo to reduce the number of failed calls and make the test results clearer. In production scenarios, you might want to enable retries to avoid false positives from transient network issues.
You can find the complete implementation in the availability-tests.bicep file in the project repository.
SSL Certificate Validation
You’ll notice that SSLCheck is set to false in the example above. I have two reasons for this approach.
First, I don’t check the SSL certificate of backends I’m not responsible for.
Second, in most integration projects Azure API Management is used as the API Gateway and I usually also create availability tests for API Management itself. In that case, I create two separate tests:
- A test that checks the availability of API Management using the standard status endpoint
/status-0123456789abcdef(or/internal-status-0123456789abcdeffor the Consumption tier) withSSLCheckdisabled - A second test on the same endpoint specifically to verify the SSL server certificate of API Management (or e.g. an Application Gateway if that’s in front of API Management)
I split this into two tests because the test with SSL check enabled will fail if the certificate is about to expire. When that happens, you need to drill down into the availability test results to verify whether the cause is certificate expiration or actual downtime of API Management. By separating these concerns, you can quickly identify if there’s a real availability issue or just a certificate warning.
Here’s an example of a test with SSL validation enabled:
resource sslValidationTest 'Microsoft.Insights/webtests@2022-06-15' = {
  name: sslTestName
  location: location
  tags: {
    'hidden-link:${appInsights.id}': 'Resource'
  }

  properties: {
    Name: 'Standard Test - SSL Certificate Validation'
    Description: 'Validates the SSL certificate of API Management'
    SyntheticMonitorId: 'Standard Test - SSL Certificate Validation'

    Kind: 'standard'
    Enabled: true
    RetryEnabled: false

    Frequency: 900

    Locations: [
      {
        Id: 'emea-nl-ams-azr' // West Europe
      }
    ]

    Request: {
      HttpVerb: 'GET'
      RequestUrl: 'https://<your-api-management-service-name>.azure-api.net/status-0123456789abcdef'
    }

    ValidationRules: {
      ExpectedHttpStatusCode: 200
      IgnoreHttpStatusCode: false
      SSLCheck: true
      SSLCertRemainingLifetimeCheck: 30
    }
  }
}
For the SSL check, in a real-world scenario I would set the frequency to the maximum of 900 (15 minutes) and execute the test from a single location. We don’t need to be notified the instant that the certificate expires within 30 days, and this approach minimizes costs. However, for demo purposes I set the frequency to 300 (5 minutes) and configured multiple locations in my sample.
Viewing Availability Test Results
After deploying the availability tests, you can view the results in several places within the Azure portal.
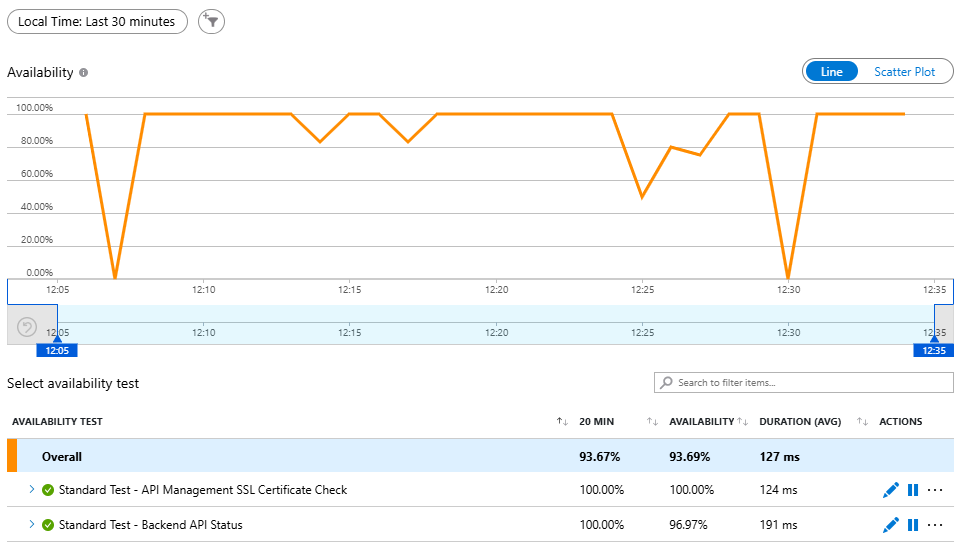
The main availability overview shows all your tests with their success rates. Navigate to your Application Insights resource and select “Availability” from the left menu. You’ll see a timeline showing the availability percentage and a list of all configured tests:
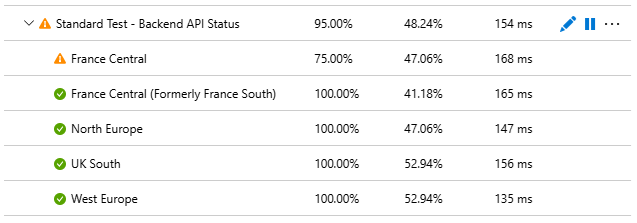
Expand on any test to see more detailed results, including which locations succeeded or failed:
To view individual test run details, select the corresponding test, click on either Successful or Failed, and then click on an availability test result in the right pane to open the end-to-end transaction details:
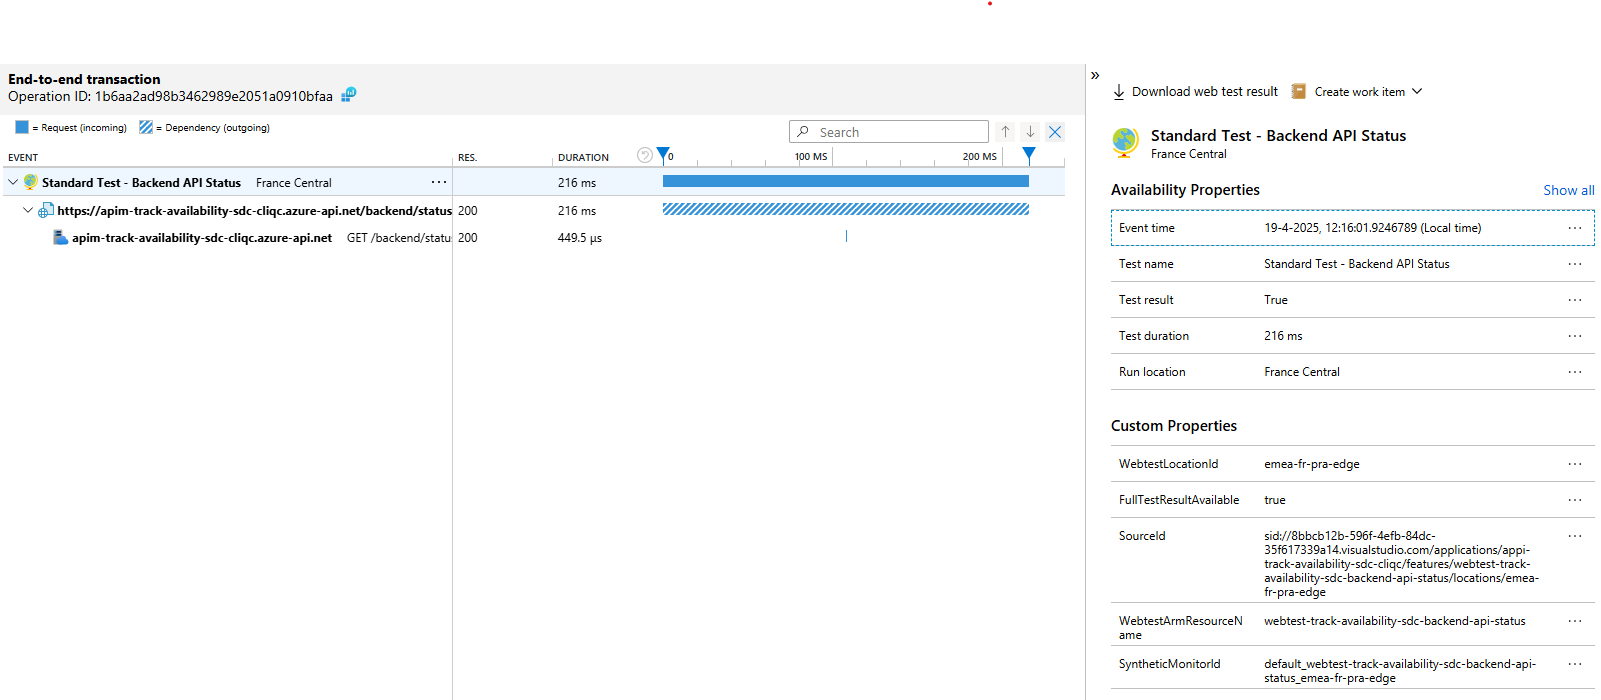
You can also query the results yourself using Kusto Query Language (KQL). The availability test results are stored in the availabilityResults table in Application Insights and the AppAvailabilityResults table in Log Analytics.
Setting Up Alerts
To act on a failed availability test, you can create an alert that sends an email to your team or triggers other actions.
First, create an action group using the Microsoft.Insights/actionGroups that defines what happens when an alert is triggered. In this example, I’ll configure it to send an email:
resource actionGroup 'Microsoft.Insights/actionGroups@2023-01-01' = {
  name: actionGroupName
  location: 'Global'

  properties: {
    enabled: true
    groupShortName: 'alerts'
    emailReceivers: [
      {
        name: 'your-name'
        emailAddress: 'your-email@example.com'
        useCommonAlertSchema: true
      }
    ]
  }
}
The action group can include multiple types of receivers: email, SMS, Azure Functions, Logic Apps, webhooks and more. The useCommonAlertSchema property ensures the alert payload follows a consistent format across different alert types.
Next, create a metric alert using the Microsoft.Insights/metricAlerts resource that triggers when the availability test fails:
resource failedAvailabilityTestAlert 'Microsoft.Insights/metricAlerts@2018-03-01' = {
  name: failedAvailabilityTestAlertName
  location: 'global'

  properties: {
    description: 'Alert that triggers when backend status availability test fails'
    severity: 1
    enabled: true
    autoMitigate: true

    scopes: [
      appInsights.id
      availabilityTest.id
    ]

    actions: [
      {
        actionGroupId: actionGroup.id
      }
    ]

    evaluationFrequency: 'PT5M'
    windowSize: 'PT5M'

    criteria: {
      webTestId: availabilityTest.id
      componentId: appInsights.id
      failedLocationCount: 1
      'odata.type': 'Microsoft.Azure.Monitor.WebtestLocationAvailabilityCriteria'
    }
  }
}
The key properties to understand:
The name of the alert can have white spaces so you can give the alert a descriptive name. I usually include some details about the environment, like the app insight name, to make it easier to identify the alert later.
The severity property ranges from 0 (critical) to 4 (informational). I’ve set it to 1 (error) because availability issues typically require prompt attention.
The autoMitigate property automatically resolves the alert when the condition is no longer true. When the availability test starts succeeding again, the alert will resolve itself.
The scopes array contains the list of resource id’s that this metric alert is scoped to and includes Application Insights and the specific web test.
The evaluationFrequency and windowSize properties control how often the alert rule runs and what time window it looks at. In this case, the alert evaluates every 5 minutes and looks at the last 5 minutes of data.
The failedLocationCount in the criteria section determines how many locations must fail before the alert triggers. Setting it to 1 means the alert fires if any single location reports a failure. In production, you might want to set this to a higher number to avoid false positives from transient issues in a single region.
This example creates an alert for a specific test, which means you need to create an alert per test. In the next blog post, I show how to create a single alert that covers all availability tests.
Once configured, you can view fired alerts in the Azure portal by navigating to your Application Insights resource and selecting “Alerts” from the left menu. You’ll see a list of all alerts with their current state:
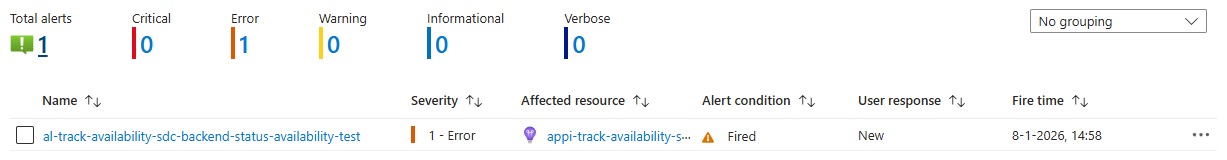
When an alert fires, it will appear in this list and you’ll receive an email notification (or whatever action you configured in the action group). The alert will automatically resolve when the availability test succeeds again.
Considerations
While standard tests are useful for basic availability monitoring, there are some restrictions to consider:
The standard test doesn’t support multiple steps, so you can’t use it in scenarios where you for example first need to retrieve an access token. If you need to authenticate with OAuth or another multi-step authentication flow, you’ll need to use custom ‘TrackAvailability’ tests, which I’ll cover in the next post in this series.
Standard tests don’t support mutual TLS (mTLS) either. If your backend requires client certificates for authentication, you’ll need to use a custom availability test as well.
You can add headers to standard tests, like an API key, but you can’t refer to a secret in a Key Vault. This means the API key will be stored in plain text in the standard test configuration. For scenarios requiring secret management, custom availability tests provide better security.
The tests run on shared Azure resources and can’t access resources that aren’t exposed to the internet. If your backend is behind a private network, you’ll need to deploy custom availability tests within your VNet.
From a cost perspective, a web test costs €0.0005 per execution, which seems cheap. But if you execute it every minute, a single test will cost a bit more than €20 per month. If you have 10 tests running every minute, you’ll spend over €200 per month, and you’ll most likely deploy them into multiple environments. So it’s important to carefully consider the frequency and number of locations from which you want to execute these tests. I usually have the tests execute less often in dev & test environments. I also only add a few standard tests and execute the rest from e.g. Azure Functions with a service plan, where the additional cost per test is lower (mostly network traffic and logging).
Conclusion
Deploying availability tests in Application Insights using Bicep provides several benefits:
- Infrastructure as code: Reproduce your monitoring configuration across environments
- Early problem detection: Catch connectivity and security issues before they impact production
- Cost-effective monitoring: Standard tests provide basic availability monitoring at a low cost
Standard tests work well for simple HTTP(S) availability checks of publicly accessible endpoints. For more complex scenarios involving authentication, private networks or multi-step flows, you’ll need custom availability tests, which I’ll cover in the upcoming posts in this series.
You can find the complete working example in my track-availability-in-app-insights repository, which includes detailed deployment instructions and examples for all three availability test approaches.